Occupancy report
Daily and weekly occupancy rate, peak day and peak hour in KPI cards. Trend chart shows the last 7 days.

Reporting
Weekly and monthly KPI summaries, channel mix, and trend charts. Tenant-scoped access.
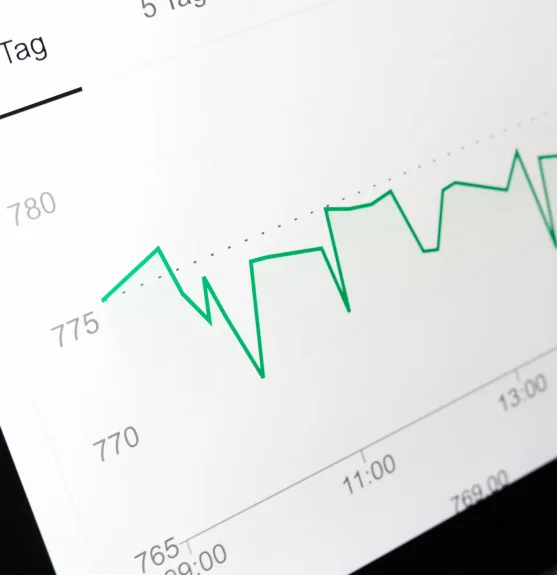
Occupancy, channel share, and spend trends. RBAC-protected report panel.
Occupancy, channels, spend notes, and period summary work together. Management decides from the same data set.
Daily and weekly occupancy rate, peak day and peak hour in KPI cards. Trend chart shows the last 7 days.
Reservation share for web, phone, walk-in, and manual channels. See which channel is growing with data.
Spend notes from closed reservations are listed. Track average spend and trends.
Switch between 7, 30, and 90-day periods. All KPI cards update for the selected period.
View reports for one venue or all venues in multi-venue businesses. Compare performance.
Define limited views for non-admin roles to restrict or expand report access.
Catch occupancy drops early and optimize channel investment. Weekly summary ready for management meetings.
Multi-venue revenue summary, channel share, and no-show rate in one panel. Management decides from the same KPI set.
Hourly occupancy heatmap and peak-hour bars guide staffing, stock, and table planning with data.
Export-ready audit trail and manager summary; channel performance and revenue trends reported transparently.
Get started
Submit the form or request a callback and we will set up your venue profile together. No commission — guests book with you directly.
Connect your calendar, floor plan, and booking channels: website widget, Google Business Profile, and WhatsApp link. No-code embed — most venues go live the same day.
Go live with instant guest confirmations, team alerts, and automated reminders across SMS, email, and WhatsApp. Start accepting reservations around the clock.
From live KPI dashboard to period comparison, venue breakdown to role-based filters. Report flow in one panel.
Real-time covers, no-show rate, and average spend tiles update live. One glance during peak hours.
See this week vs last week side by side. Track occupancy, reservations, and channel share changes with delta bars.
Rank each location by occupancy and revenue in multi-venue businesses. Spot top performers and growth opportunities.
CSV and PDF export queue with selected period and filters. Ready files for management meetings and audits.
Managers see all venues; hosts see floor-only view. Limited views via reports:read role definitions.
Manage operation data proactively with forecast summary and anomaly alerts — a new insight layer beyond weekly KPI tabs.
Expected occupancy and revenue projection for the next 7 days. Recommendation band based on past trends and seasonality.
No-show spikes, channel drops, or occupancy anomalies flagged automatically. Instant notification when thresholds are exceeded.
No-show rate 5.4% — 7-day avg 3.2%
Web channel share −8 pts
Fri 9 pm occupancy below forecast
Reviewed